Price Sensitivity Analysis is used to confirm if the product is priced in line with customer perceptions based on value of the product on a whole or the value of individual features, helping marketers develop a successful marketing plan by developing an appropriate pricing strategy.
Outsourcing Pricing Sensitivity Analysis to Market Equations helps marketers understand the demand on specific price points, calculate the optimum pricing and develop a product-price trade off. It helps determine which product features are traded off at different price levels to help marketers develop value propositions that are most in demand by customers.

Case Study: Price Sensitivity Analysis on survey data for a large Snack Bar manufacturer
Objective
- To successfully launch a new variant in order to broaden the brands interest and appeal.
- To determine the most appealing concepts among other factors the purchase intent (price sensitivity)
Challenges
- The Nutritious Snack market experienced a 8.5 per cent growth compared to the last 52 weeks.
- Growth slowed down from double digit growth in previous years.
- Certain categories have delivered growth but new entrants are proving to have an impact on this category.
- In order to maintain leadership new flavors need to be launched.
Approach
Respondents were asked the following questions:
Q1: At what price would you consider the product to be priced so low that you feel that the quality could be compromised?
Q2: At what price would you consider this product to be a bargain?
Q3: At what price would you say this product is starting to get expensive that you would have to think before buying it?
Q4: At what price would you consider the product to be so expensive that you would not consider buying it?
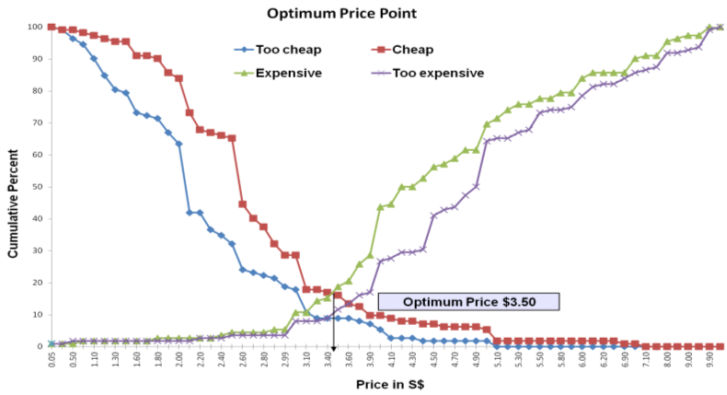
The Price Sensitivity Analysis (PSA) was used to determine the acceptable price ranges and optimal price point for the new entrant. Respondents were asked to insert the optimum price point at which they would purchase the product. Responses were then divided into 4 categories - Too Expensive, Expensive, Cheap and Too Cheap. The data collected was then plotted into a price map to reveal high/low price s as well as the optimal price point.

Outcome
The client was able to determine the optimal price for the new entrant that would lead to the purchase of the product.


