Early Warning Delinquency predictive models help organizations detect customers who have a higher likelihood of defaulting or turning bad debt. Early warning signals help organizations take proactive action to maximize collection and recoveries, enhance retention, reduce costs and maximize profitability.
The Market Equations Centre of Excellence in India combines advanced analytics and modeling expertise and decades of consulting experience to help organizations develop predictive analytics models that can be used as an early warning system to detect customers who have a higher likelihood of defaulting or turning bad debt. Models scores could then be used to build smart recovery and retention strategies.
FREE Data Health Test and Consultation. Contact Us!

Market Equations helped one of the largest Telecommunications providers in the US develop a Early Warning Delinquency predictive analytics model to be used in a live collection environment to predict customers who are going to be disconnected or bankrupt in the next six months.
Objective:
- Identify customers who are more likely to discontinue their service within the next six months after coming into collections for the first time.
- Segment customers based on the model scores to design different strategies for collection and retention.
Approach

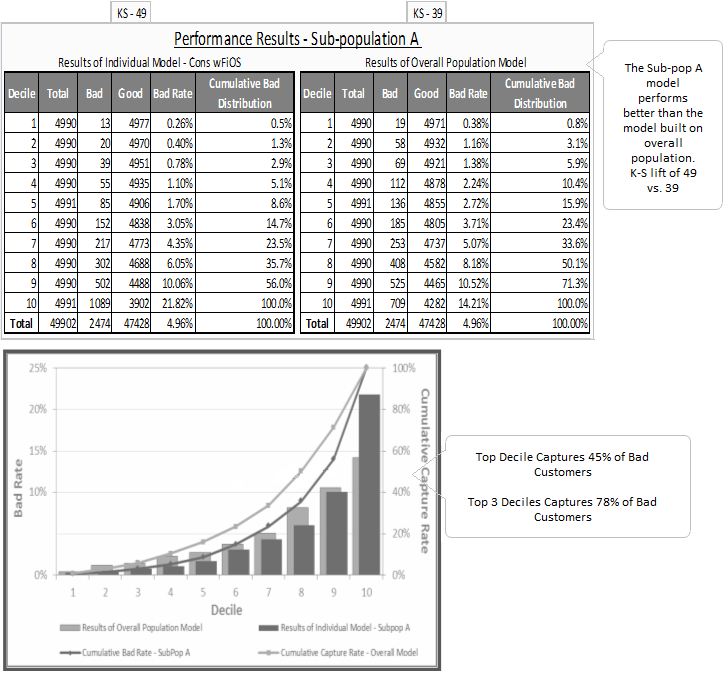
The data provided by the client primarily consisted of the month on month billing, payment and product related information. Based on the client's input, the target customers (customers discontinuing their services in the next six months) were tagged in the data. It was observed that the different customer segments were exhibiting different sets of payment behaviors. Clustering was used to identify different sub-populations in the data and it was decided to build different models for them.
Different statistical techniques like univariate, bivariate analysis, selection by regression etc. were used to identify the important characteristics that govern the customers' payment behavior for each sub-population. Since the target was binary in nature the most suitable model was the logistic model.
The output of the model was a score for each of the customers. Higher the score the greater the likelihood of a customer discontinuing or terminating the service.
Project Process Map
Phase 1: Predictive Characteristic Analysis
An analysis showing the predictive power of various Strata extract attributes and derived attributes available at the observation point. It includes rank-order account predictors for the "bad" definition (objective function).
Phase 2: Sub-Population Analysis
Assess the improvement to overall predictive strength of developing models for other sub-populations
- Includes creation of prototype models for selected sub-populations
- Includes performance charts and K-S statistics of prototype models
Phase 3: Final Behavior Model Specifications
Final documentation of model(s) showing predictive strength and specifications for implementation: Includes performance charts and K-S statistics of final model Documentation of final model attributes and point allocation or coefficients ready for input into database engine

Outcome
Using our approach our client now has a scientific approach for their collection strategies to optimize their collection efforts. This tool is being used in a live collection environment with an automated alert system that raise indications of customers in terms of high, medium or low risk level at the time of their first default itself.


